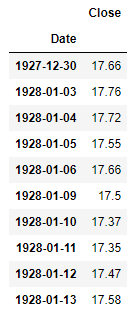
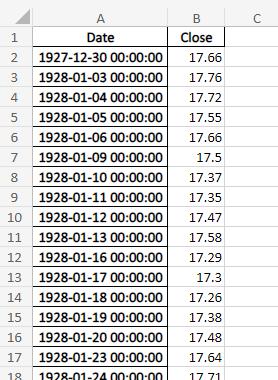
Featured image of post Cleaning A Bloomberg Data Excel Export

Cleaning A Bloomberg Data Excel Export

A python function to clean and format an excel data export from Bloomberg.

Introduction

In this tutorial, we will write a python function that imports an excel export from Bloomberg, removes ancillary rows and columns, and leaves the data in a format where it can then be used in time series analysis.

Example of a Bloomberg excel export

We will use the SPX index data in this example. Exporting the data from Bloomberg using the excel Bloomberg add-on yields data in the following format:
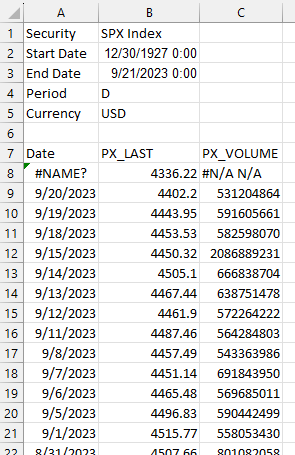
Format of data in excel export from Bloomberg

Data modifications

The above format isn’t horrible, but we want to perform the following modifications:

  1. Remove the first six rows of the data
  2. Convert the 7th row to become column headings
  3. Rename column 2 to “Close” to represent the closing price
  4. Remove column 3, as we are not concerned about volume
  5. Export to excel and make the name of the excel worksheet “data”

Assumptions

The remainder of this tutorial assumes the following:

  • Your excel file is named “SPX_Index.xlsx”
  • The worksheet in the excel file is named “Worksheet”
  • You have the pandas library installed
  • You have the OpenPyXL library installed

Python function to modify the data

The following function will perform the modifications mentioned above:

 1
 2
 3
 4
 5
 6
 7
 8
 9
10
11
12
13
14
15
16
17
18
19
20
21
22
23
24
25
26
27
28
29
30
31
32
33
34
35
36
37
38
39
40
41
42
43
44
45
46
47
48
# This function takes an excel export from Bloomberg and 
# removes all excess data leaving date and close columns

# Imports
import pandas as pd

# Function definition
def bb_data_updater(fund):

    # File name variable
    file = fund + "_Index.xlsx"
    
    # Import data from file as a pandas dataframe
    df = pd.read_excel(file, sheet_name = 'Worksheet', engine='openpyxl')
    
    # Set the column headings from row 5 (which is physically row 6)
    df.columns = df.iloc[5]
    
    # Set the column heading for the index to be "None"
    df.rename_axis(None, axis=1, inplace = True)
    
    # Drop the first 6 rows, 0 - 5
    df.drop(df.index[0:6], inplace=True)
    
    # Set the date column as the index
    df.set_index('Date', inplace = True)
    
    # Drop the volume column
    try:
        df.drop(columns = {'PX_VOLUME'}, inplace = True)
    except KeyError:
        pass
        
    # Rename column
    df.rename(columns = {'PX_LAST':'Close'}, inplace = True)
    
    # Sort by date
    df.sort_values(by=['Date'], inplace = True)
    
    # Export data to excel
    file = fund + ".xlsx"
    df.to_excel(file, sheet_name='data')
    
    # Output confirmation
    print(f"The last date of data for {fund} is: ")
    print(df[-1:])
    print(f"Bloomberg data conversion complete for {fund} data")
    return print(f"--------------------")

Let’s break this down line by line.

Imports

First, we need to import pandas:

1
import pandas as pd

Import excel data file

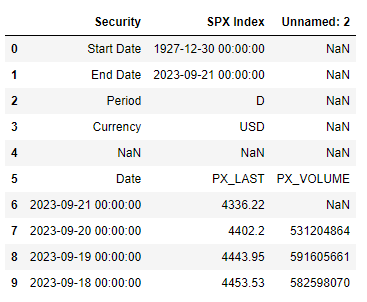
Then import the excel file as a pandas dataframe:

1
2
3
4
5
# File name variable
file = fund + "_Index.xlsx"

# Import data from file as a pandas dataframe
df = pd.read_excel(file, sheet_name = 'Worksheet', engine='openpyxl')

Running:

df.head(10)

Gives us:

Dataframe excel import

Set column headings

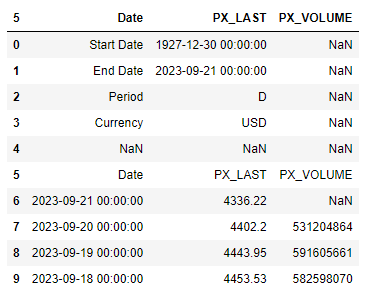
Next, set the column heading:

1
2
# Set the column headings from row 5 (which is physically row 6)
df.columns = df.iloc[5]

Now, running:

df.head(10)

Gives us:

Set column headings

Remove index heading

Next, remove the column heading from the index column:

1
2
# Set the column heading for the index to be "None"
df.rename_axis(None, axis=1, inplace = True)

Note: The axis=1 argument here specifies the column index.

Now, running:

df.head(10)

Gives us:
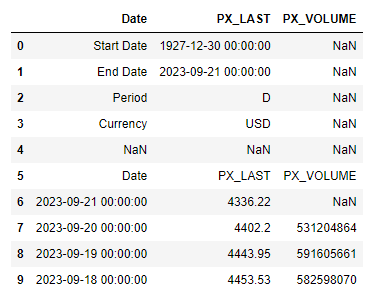
Remove index heading

Drop rows

Next, we want to remove the first 6 rows that have unneeded data:

1
2
# Drop the first 6 rows, 0 - 5
df.drop(df.index[0:6], inplace=True)

Note: When dropping rows, the range to drop begins with row 0 and continues up to - but not including - row 6.

Now, running:

df.head(10)

Gives us:
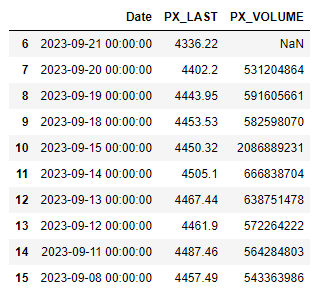
Remove rows

Set index

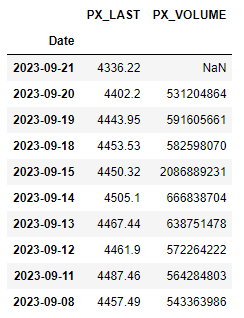
Next, we want to set the date column as the index:

1
2
# Set the date column as the index
df.set_index('Date', inplace = True)

Now, running:

df.head(10)

Gives us:

Set index

Drop the “PX_VOLUME” column

Next, we want to drop the volume column:

1
2
3
4
5
# Drop the volume column
try:
    df.drop(columns = {'PX_VOLUME'}, inplace = True)
except KeyError:
    pass

For some data records, the volume column does not exist. Therefore, we try, and if it fails with a KeyError, then we assume the “PX_VOLUME” column does not exist, and just pass to move on.

Now, running:

df.head(10)

Gives us:
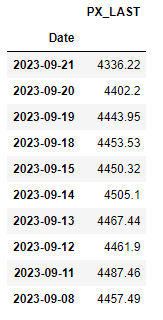
Drop volume

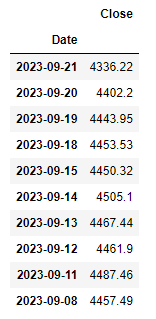
Rename the “PX_LAST” column

Next, we want to rename the “PX_LAST” column as “Close”:

1
2
# Rename column
df.rename(columns = {'PX_LAST':'Close'}, inplace = True)

Now, running:

df.head(10)

Gives us:

Rename column

Sort data

Next, we want to sort the data starting with the oldest date:

1
2
# Sort by date
df.sort_values(by=['Date'], inplace = True)

Now, running:

df.head(10)

Gives us:

Sort by date

Export data

Next, we want to export the data to an excel file, for easy viewing and reference later:

1
2
3
# Export data to excel
file = fund + ".xlsx"
df.to_excel(file, sheet_name='data')

And verify the output is as expected:

Excel export

Output confirmation

Finally, we want to print a confirmation that the process succeeded along withe last date we have for data:

1
2
3
4
5
# Output confirmation
print(f"The last date of data for {fund} is: ")
print(df[-1:])
print(f"Bloomberg data conversion complete for {fund} data")
print(f"--------------------")

And confirming the output:

Output confirmation

References

https://www.bloomberg.com/professional/support/software-updates/

Built with Hugo
Theme Stack designed by Jimmy